
Food for Thought (*Buddumm Chiiii*)
I find all this interesting, but perhaps you won't. Just please don't hurt me.
Industry Profiles
Which candidates is the computer industry giving to? What are the patterns in tobacco contributions over the last ten years? Where is the political money coming from within the agribusiness industries? You can answer this kind of question effortlessly here, with this one-of-a-kind resource.
Meat processing & products:
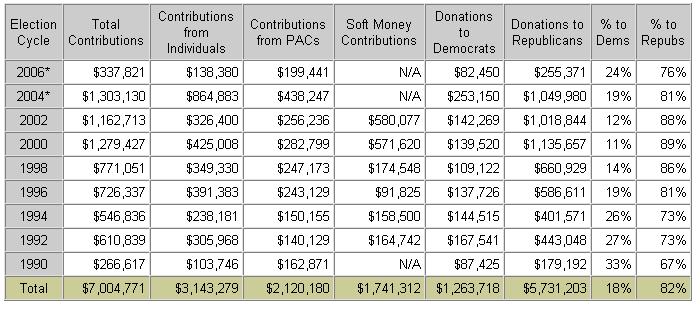
Long-Term Contribution Trends
*These figures do not include donations of "Levin" funds to state and local party committees. Levin funds were created by the Bipartisan Campaign Reform Act of 2002.
METHODOLOGY: The numbers on this page are based on contributions of $200 or more from PACs and individuals to federal candidates and from PAC, soft money and individual donors to political parties, as reported to the Federal Election Commission. While election cycles are shown in charts as 1996, 1998, 2000 etc. they actually represent two-year periods. For example, the 2002 election cycle runs from January 1, 2001 to December 31, 2002. Data for the current election cycle were released by the Federal Election Commission on Monday, January 23, 2006.
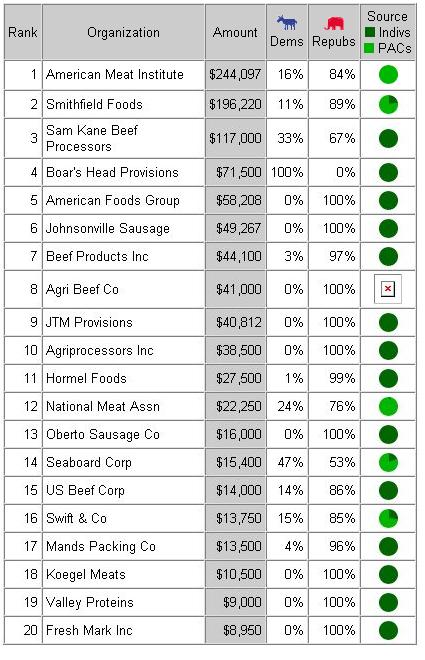
Meat processing & products:
Top Contributors to Federal Candidates and Parties
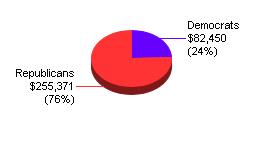
Election cycle: 2004
Total contributions: $337,821
 (from http://www.opensecrets.org/industries/contrib.asp?Ind=G2300&Cycle=2004)
(All data from http://www.opensecrets.org/)
-------

0 Comments:
Post a Comment
Subscribe to Post Comments [Atom]
<< Home